Tag Archives: Queue

Microservices in C# Part 5: Autoscaling

Fork me on GitHub

Balancing demand and processing power

Balancing demand and processing power

Autoscaling Microservices

In the previous tutorial, we demonstrated the throughput increase by invoking multiple instances of SimpleMathMicroservice, in order to facilitate a greater number of concurrent inbound HTTP requests. We experimented with various configurations, increasing the count of simultaneously running instances of SimpleMathMicroservice until the law of diminishing returns set it.

This is a perfectly adequate configuration for applications that absorb a consistent number of inbound HTTP requests over any given extended period of time. Most web applications, of course, do not adhere to this model. Instead, traffic tends to fluctuate, depending on several factors, not least of which is the type of business that the web application facilitates.

This presents a significant problem, in that we cannot manually throttle the number of concurrently running Microservice instances on-demand, as traffic dictates. We need an automated mechanism to scale our Microservice instances adequately.

Autoscaling involves more than simply increasing the count of running instances during heavy load. It also involves the graceful termination of superfluous instances, or instances that are no longer necessary to meet the demands of the application as load is reduced. Daishi.AMQP provides just such features, which we’ll cover in detail.

QueueWatch

QueueWatch is a mechanism that allows the monitoring of RabbitMQ Queues in real time. It achieves this by polling the RabbitMQ Management API (mentioned in Part #3) at regular intervals, returning metadata that describes the current state of each Queue.

Metadata

RabbitMQ exposes important metadata pertaining to each Queue. This metadata is presented in a user-friendly manner in the RabbitMQ Management Console:

Message Rates

Message Rates

These metrics represent the rates at which messages are processed by RabbitMQ. “Publish” illustrates the rate at which messages are introduced to the server, while “Deliver” represents the rate at which messages are dispatched to listening consumers (Microservices, in our case).

This information is readily available in the RabbitMQ Management API. QueueWatch effectively harvests this information, comparing the values retrieved in the latest poll with those retrieved in the previous, to monitor the flow of messages through RabbitMQ. QueueWatch can determine whether or not any given Queue is idling, overworked, or somewhere in between.

Once a Queue is determined to be under heavy load, QueueWatch triggers an event, and dispatches an AutoScale message to the Microservice consuming the heavily-laden Queue. The Microservice can then instantiate more AMQPConsumer instances in order to drain the Queue sufficiently.

Just Show Me the Code

Create a new Microservice instance called QueueWatchMicroservice; an implementation of Microservice, and add the following code to the Init method:

            var amqpQueueMetricsManager = new RabbitMQQueueMetricsManager(false, "localhost", 15672, "paul", "password");

            AMQPQueueMetricsAnalyser amqpQueueMetricsAnalyser = new RabbitMQQueueMetricsAnalyser(
                new ConsumerUtilisationTooLowAMQPQueueMetricAnalyser(
                    new ConsumptionRateIncreasedAMQPQueueMetricAnalyser(
                        new DispatchRateDecreasedAMQPQueueMetricAnalyser(
                            new QueueLengthIncreasedAMQPQueueMetricAnalyser(
                                new ConsumptionRateDecreasedAMQPQueueMetricAnalyser(
                                    new StableAMQPQueueMetricAnalyser()))))), 20);

            AMQPConsumerNotifier amqpConsumerNotifier = new RabbitMQConsumerNotifier(RabbitMQAdapter.Instance, "monitor");
            RabbitMQAdapter.Instance.Init("localhost", 5672, "paul", "password", 50);

            _queueWatch = new QueueWatch(amqpQueueMetricsManager, amqpQueueMetricsAnalyser, amqpConsumerNotifier, 5000);
            _queueWatch.AMQPQueueMetricsAnalysed += QueueWatchOnAMQPQueueMetricsAnalysed;

            _queueWatch.StartAsync();

There’s a lot to talk about here. Firstly, remember that the primary function of QueueWatch is to poll the RabbitMQ Management API. In doing so, QueueWatch returns several metrics pertaining to each Queue. We need to decide which metrics we are interested in.

Metrics are represented by implementations of AMQPQueueMetricAnalyser, and chained together as per the Chain of Responsibility Design Pattern. Each link in the chain is executed until a predefined performance condition is met. For example, let’s consider the ConsumerUtilisationTooLowAMQPQueueMetricAnalyser. This implementation of AMQPQueueMetricAnalyser inspects the ConsumerUtilisation metric, and determines whether the value is less than 99%, in which case, there are not enough consuming Microservices to adequately drain the Queue. At this point, a ConsumerUtilisationTooLow value is returned, the chain of execution ends, and QueueWatch issues an AutoScale directive:

        public override void Analyse(AMQPQueueMetric current, AMQPQueueMetric previous, ConcurrentBag<AMQPQueueMetric> busyQueues, ConcurrentBag<AMQPQueueMetric> quietQueues, int percentageDifference) {
            if (current.ConsumerUtilisation >= 0 && current.ConsumerUtilisation < 99) {
                current.AMQPQueueMetricAnalysisResult = AMQPQueueMetricAnalysisResult.ConsumerUtilisationTooLow;
                busyQueues.Add(current);
            }
            else analyser.Analyse(current, previous, busyQueues, quietQueues, percentageDifference);
        }

Scale-Out Directive

Scaling out

Scaling out

QueueWatch must issue Scale-Out directives through dedicated Queues in order to adhere to the Decoupled Middleware design. QueueWatch should not know anything about the downstream Microservices, and should instead communicate through AMQP, specifically, through a dedicated Exchange.

Each Microservice must now listen to 2 Queues. E.g., SimpleMathMicroservice will continue listening to the Math Queue, as well as a Queue called AutoScale, for the purpose of demonstration. SimpleMathMicroservice will receive Scale-Out directives through this Queue. We should modify SimpleMathMicroservice accordingly:

        public void Init() {
            _adapter = RabbitMQAdapter.Instance;
            _adapter.Init("localhost", 5672, "guest", "guest", 50);

            _rabbitMQConsumerCatchAll = new RabbitMQConsumerCatchAll("Math", 10);
            _rabbitMQConsumerCatchAll.MessageReceived += OnMessageReceived;

            _autoScaleConsumerCatchAll = new RabbitMQConsumerCatchAll("AutoScale", 10);
            _autoScaleConsumerCatchAll.MessageReceived += _autoScaleConsumerCatchAll_MessageReceived;

            _consumers.Add(_rabbitMQConsumerCatchAll);

            _adapter.Connect();
            _adapter.ConsumeAsync(_autoScaleConsumerCatchAll);
            _adapter.ConsumeAsync(_rabbitMQConsumerCatchAll);
        }

Create a Topic Exchange called “monitor”. QueueWatch will publish to this Exchange, which will route the message to an appropriate Queue. Now create a binding between the monitor Exchange and the AutoScale Queue:
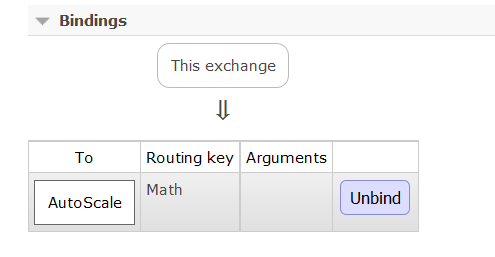
Exchange Binding

Exchange Binding

Note that the Routing Key is the name of the Queue under monitor. If QueueWatch determines that the Math Queue is under load, then it will issue a Scale-Out directive to the monitor Exchange, with a Routing Key of “Math”. The monitor Exchange will react by routing the Scale-Out directive to the AutoScale Queue, to which an explicit binding exists. SimpleMathMicroservice consumes the Scale-Out directive and reacts appropriately, by instantiating a new AMQPConsumer:

            if (e.Message.Contains("scale-out")) {
                var consumer = new RabbitMQConsumerCatchAll("Math", 10);
                _adapter.ConsumeAsync(consumer);
                _consumers.Add(consumer);
            }
            else {
                if (_consumers.Count <= 1) return;
                var lastConsumer = _consumers[_consumers.Count - 1];

                _adapter.StopConsumingAsync(lastConsumer);
                _consumers.RemoveAt(_consumers.Count - 1);
            }

Summary

QueueWatch provides a means of returning key RabbitMQ Queue metrics at regular intervals, in order to determine whether demand, in terms of the number of running Microservice instances, is waxing or waning. QueueWatch also provides a means of reacting to such events, by publishing AutoScale notifications to downstream Microservices, so that they can scale accordingly, providing sufficient processing power at any given instant. The process is simplified as follows:

  1. QueueWatch returns metrics describing each Queue
  2. Queue metrics are compared against the last batch returned by QueueWatch
  3. AutoScale messages are dispatched to a Monitor Exchange
  4. AutoScale messages are routed to the appropriate Queue
  5. AutoScale messages are consumed by the intended Microservices
  6. Microservices scale appropriately, based on the AutoScale message

Next Steps

  • Prevent a “bounce” effect as traffic arbitrarily fluctuates for reasons not pertaining to application usage, such as network slow-down, or hardware failure
  • The current implementation compares metrics in a very simple fashion. Future implementations will instead graph metric metadata, and react to more thoroughly defined thresholds

Connect with me:

RSSGitHubTwitter
LinkedInYouTubeGoogle+

Microservices in C# Part 3: Queue Pool Sizing

Fork me on GitHub

Fine tuning QueuePool

Fine tuning QueuePool

This tutorial expands on the previous tutorial, focusing on the Queue Pool concept. By way of quick refresher, a Queue Pool is a feature of the Daishi.AMQP library that allows AMQP Queues to be shared among clients in a concurrent capacity, such that each Queue will have 0…1 consumers only. The concept is not unlike database connection-pooling.

We’ve built a small application that leverages a simple downstream Microservice, implements the AMQP protocol over RabbitMQ, and operates a QueuePool mechanism. We have seen how the QueuePool can retrieve the next available Queue:

var queue = QueuePool.Instance.Get();

And how Queues can be returned to the QueuePool:

QueuePool.Instance.Put(queue);

We have also considered the QueuePool default Constructor, how it leverages the RabbitMQ Management API to return a list of relevant Queues:

        private QueuePool(Func&amp;lt;AMQPQueue&amp;gt; amqpQueueGenerator) {
            _amqpQueueGenerator = amqpQueueGenerator;
            _amqpQueues = new ConcurrentBag&amp;lt;AMQPQueue&amp;gt;();

            var manager = new RabbitMQQueueMetricsManager(false, &amp;quot;localhost&amp;quot;, 15672, &amp;quot;paul&amp;quot;, &amp;quot;password&amp;quot;);
            var queueMetrics = manager.GetAMQPQueueMetrics();

            foreach (var queueMetric in queueMetrics.Values) {
                Guid queueName;
                var isGuid = Guid.TryParse(queueMetric.QueueName, out queueName);

                if (isGuid) {
                    _amqpQueues.Add(new RabbitMQQueue {IsNew = false, Name = queueName.ToString()});
                }
            }
        }

Notice the high-order function in the above constructor. In the QueuePool static Constructor we define this function as follows:

        private static readonly QueuePool _instance = new QueuePool(
            () =&amp;gt; new RabbitMQQueue {
                Name = Guid.NewGuid().ToString(),
                IsNew = true
            });

This function will be invoked if the QueuePool is exhausted, and there are no available Queues. It is a simple function that creates a new RabbitMQQueue object. The Daishi.AMQP library will ensure that this Queue is created (if it does not already exist) when referenced.

Exhaustion is Expensive

QueuePool exhaustion is something that we need to avoid. If our application frequently consumes all available Queues then the QueuePool will become ineffective. Let’s look at how we go about avoiding this scenario.

First, we need some targets. We need to know how much traffic our application will absorb in order to adequately size our resources. For argument’s sake, let’s assume that our MathController will be subjected to 100,000 inbound HTTP requests, delivered in batches of 10. In other words, at any given time, MathController will service 10 simultaneous requests, and will continue doing so until 100,000 requests have been served.

Stress Testing Using Apache Bench

Apache Bench is a very simple, lightweight tool designed to test web-based applications, and is bundled as part of the Apache Framework. Click here for simple download instructions. Assuming that our application runs on port 46653, here is the appropriate Apache Bench command to invoke 100 MathController HTTP requests in batches of 10:

-ab -n 100 -c 10 http://localhost:46653/api/math/150

Notice the “n” and “c” paramters; “n” refers to “number”, as in the number of requests, and “c” refers to “concurrency”, or the amount of requests to run in simultanously. Running this command will yield something along the lines of the following:

Benchmarking localhost (be patient).....done

Server Software: Microsoft-IIS/10.0
Server Hostname: localhost
Server Port: 46653

Document Path: /api/math/150
Document Length: 5 bytes

Concurrency Level: 10
Time taken for tests: 7.537 seconds
Complete requests: 100
Failed requests: 0
Total transferred: 39500 bytes
HTML transferred: 500 bytes
Requests per second: 13.27 [#/sec] (mean)
Time per request: 753.675 [ms] (mean)
Time per request: 75.368 [ms] (mean, across all concurrent requests)
Transfer rate: 5.12 [Kbytes/sec] received

Connection Times (ms)
min mean[+/-sd] median max
Connect: 0 0 0.4 0 1
Processing: 41 751 992.5 67 3063
Waiting: 41 751 992.5 67 3063
Total: 42 752 992.4 67 3063

Percentage of the requests served within a certain time (ms)
50% 67
66% 1024
75% 1091
80% 1992
90% 2140
95% 3058
98% 3061
99% 3063
100% 3063 (longest request)

Adjusting QueuePool for Optimal Results

Adjusting QueuePool
Those results don’t look great. Incidentally, if you would like more information as regards how to interpret Apache Bench results, click here. Let’s focus on the final section, “Percentage of the requests served within a certain time (ms)”. Here we see that 75% of all requests took just over 1 second (1091 ms) to complete. 10% took over 2 seconds, and 5% took over 3 seconds to complete. That’s quite a long time for such a simple operation running on a local server. Let’s run the same command again:

Benchmarking localhost (be patient).....done

Server Software: Microsoft-IIS/10.0
Server Hostname: localhost
Server Port: 46653

Document Path: /api/math/100
Document Length: 5 bytes

Concurrency Level: 10
Time taken for tests: 0.562 seconds
Complete requests: 100
Failed requests: 0
Total transferred: 39500 bytes
HTML transferred: 500 bytes
Requests per second: 177.94 [#/sec] (mean)
Time per request: 56.200 [ms] (mean)
Time per request: 5.620 [ms] (mean, across all concurrent requests)
Transfer rate: 68.64 [Kbytes/sec] received

Connection Times (ms)
min mean[+/-sd] median max
Connect: 0 0 0.4 0 1
Processing: 29 54 11.9 49 101
Waiting: 29 53 11.9 49 101
Total: 29 54 11.9 49 101

Percentage of the requests served within a certain time (ms)
50% 49
66% 54
75% 57
80% 60
90% 73
95% 80
98% 94
99% 101
100% 101 (longest request)

OK. Those results look a lot better. Even the longest request took 101 ms, and 80% of all requests completed in <= 60 ms.

But where does this discrepancy come from? Remember, that on start-up there are no QueuePool Queues. The QueuePool is empty and does not have any resources to distribute. Therefore, inbound requests force QueuePool to create a new Queue in order to facilitate the request, and then reclaim that Queue when the request has completed.

Does this mean that when I deploy my application, the first batch of requests are going to run much more slowly than subsequent requests?

No, that’s where sizing comes in. As with all performance testing, the objective is to set a benchmark in terms of the expected volume that an application will absorb, and to determine that maximum impact that it can withstand, in terms of traffic. In order to sufficiently bootstrap QueuePool, so that it contains an adequate number of dispensable Queues, we can simply include ASP.NET controllers that leverage QueuePool in our performance run.

Suppose that we expect to handle 100 concurrent users over extended periods of time. Let’s run an Apache Bench command again, setting the level of concurrency to 100, with a suitably high number of requests in order to sustain that volume over a reasonably long period of time:

ab -n 1000 -c 100 http://localhost:46653/api/math/100


Percentage of the requests served within a certain time (ms)
50% 861
66% 938
75% 9560
80% 20802
90% 32949
95% 34748
98% 39756
99% 41071
100% 42163 (longest request)

Again, very poor, but expected results. More interesting is the number of Queues now active in RabbitMQ:

New QueuePool Queues

New QueuePool Queues

In my own environment, QueuePool created 100 Queues in order to facilitate all inbound requests. Let’s run the test again, and consider the results:

Percentage of the requests served within a certain time (ms)
50% 497
66% 540
75% 575
80% 591
90% 663
95% 689
98% 767
99% 816
100% 894 (longest request)

These results are much more respectable. Again, the discrepancy between performance runs is due to the fact that QueuePool was not adequately initialised during the first run. However, QueuePool was initialised with 100 Queues, a volume sufficient to facilitate the volume of request that the application is expected to serve. This is simple an example as possible.

Real world performance testing entails a lot more than simply executing isolated commands against single endpoints, however the principal remains the same. We have effectively determined the optimal size necessary for QueuePool to operate efficiently, and can now size it accordingly on application start-up, ensuring that all inbound requests are served quickly and without bias.

Those already versed in the area of Microservices might object at this point. There is only a single instance of our Microservice, SimpleMathMicroservice, running. One of the fundamental concepts behind Microservice design is scalability. In my next article, I’ll cover scaling, and we’ll drive those performance response times into the floor.

Connect with me:

RSSGitHubTwitter
LinkedInYouTubeGoogle+